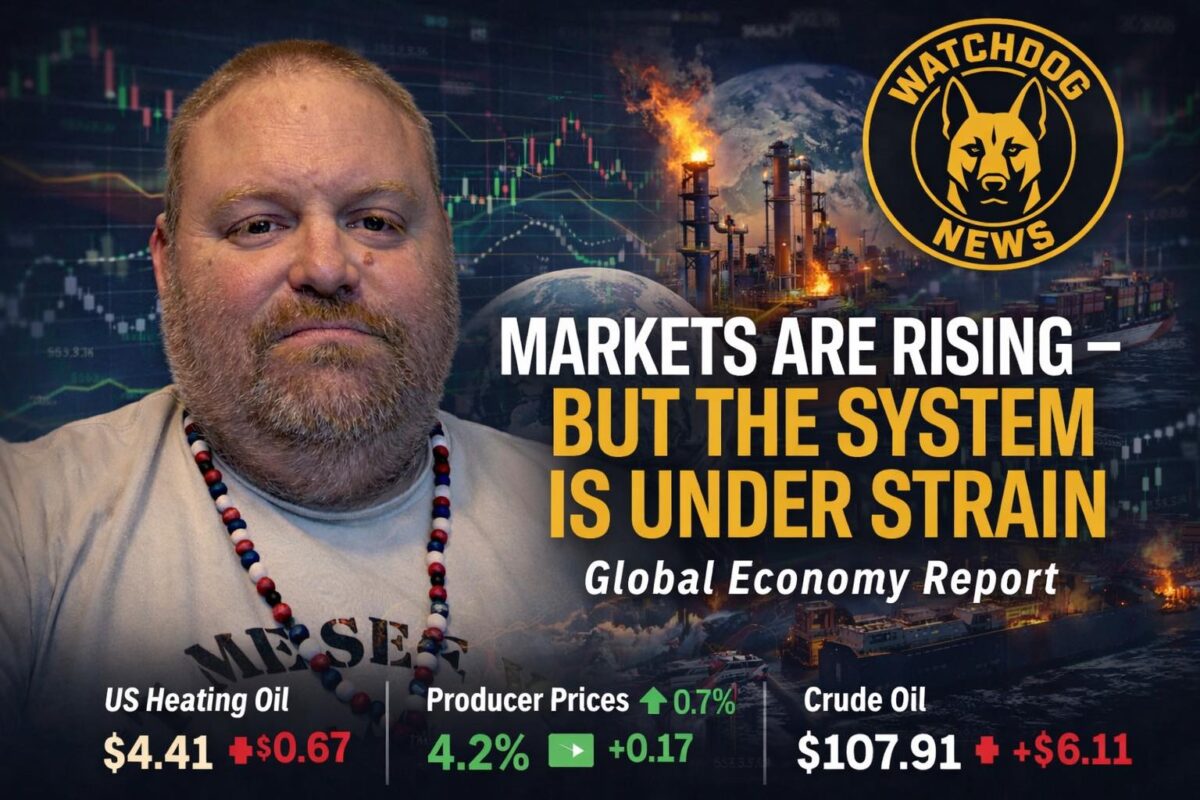


Markets may be rallying, but the global economy remains exposed to unresolved energy, shipping, and inflation risks.
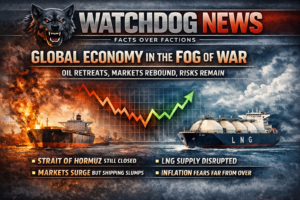
 Global Economy in the Fog of War
Oil Retreats, Markets Rebound, but the Underlying Risks Remain Very Much Alive
By Jared W. Campbell — Watchdog News
Facts Over Factions
March 10, 2026
Introduction
Over the last 16 hours, the global economy has not provided a clear answer but has instead issued a warning.
At first glance, markets appear to be stabilizing. Oil prices have sharply decreased from their panic-induced highs, and equity markets across Europe and Asia have rebounded. Bond yields in several key markets have also eased, and the dollar has lost some of its safe-haven strength. Traders are starting to reassess the situation, believing that the conflict involving Iran may conclude sooner than initially feared.
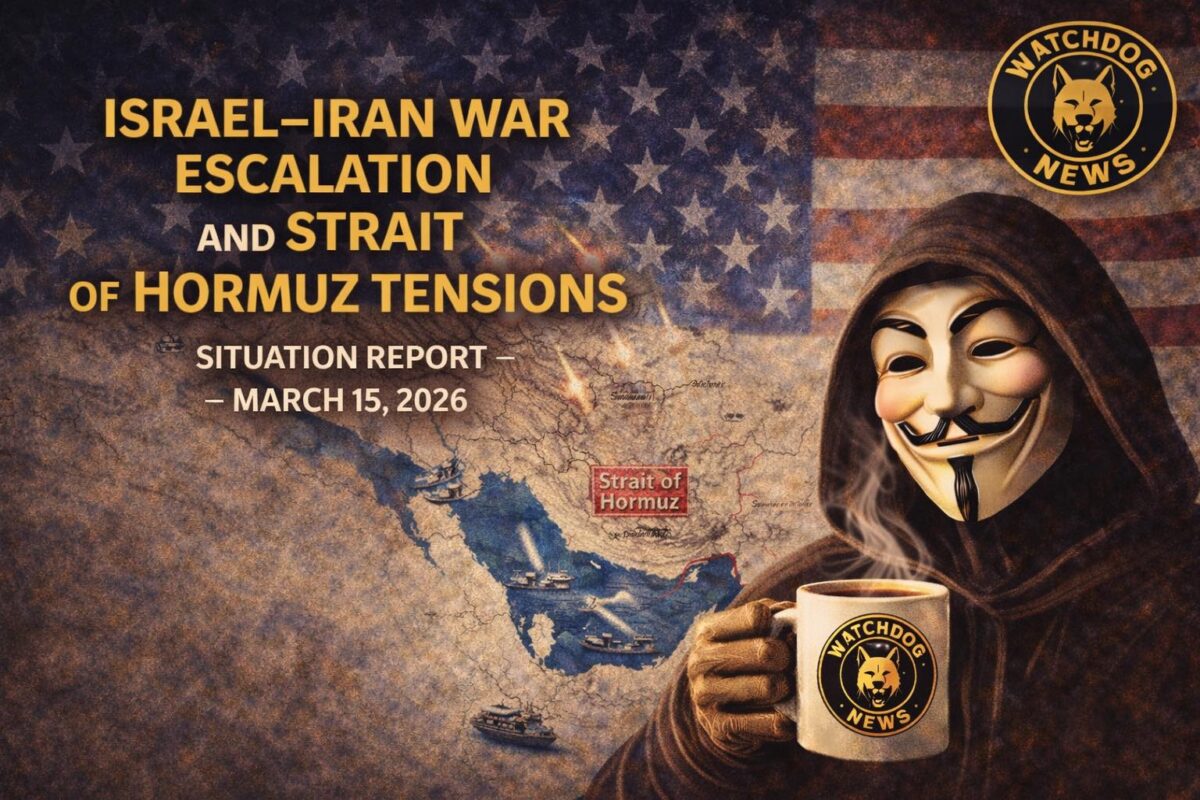
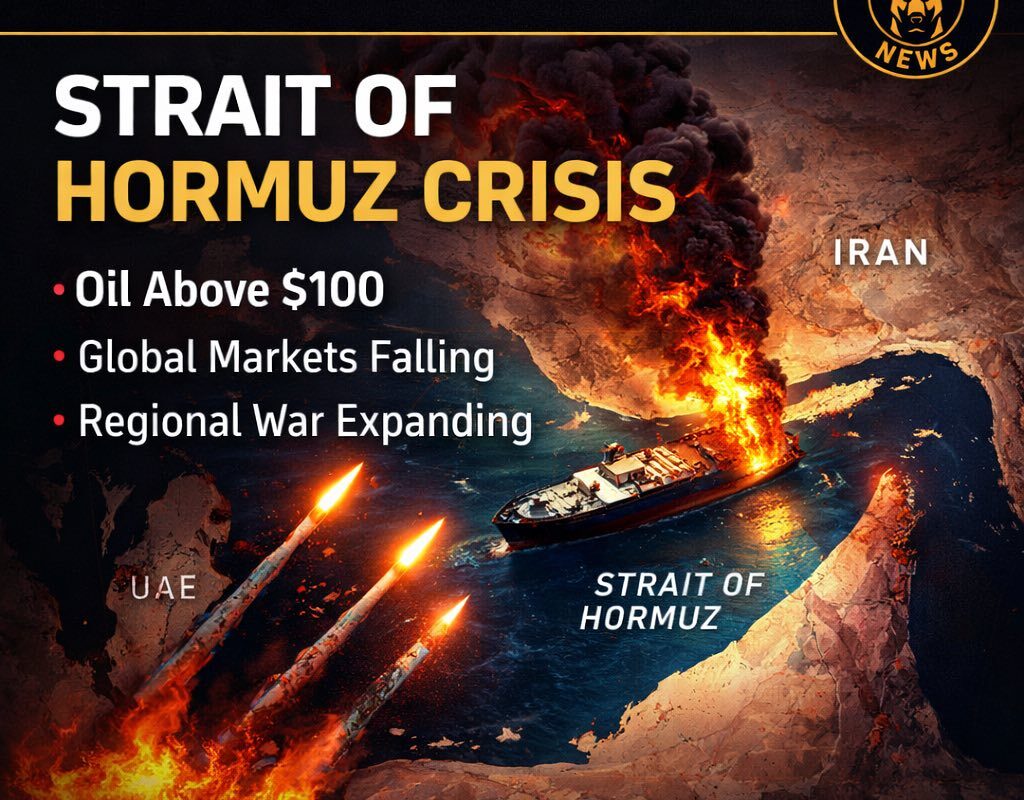
However, this relief rally only tells part of the story. Beneath the surface, the global economic landscape remains unstable. The Strait of Hormuz is still closed, and Qatar’s liquefied natural gas (LNG) operations are suspended. Shipping activity is declining, and energy markets remain at risk of experiencing another sharp reversal. Credit-sensitive sectors continue to face pressure, and trade flows are being reevaluated in real time. Furthermore, countries around the world exhibit significantly different patterns in inflation, industrial production, trade, and economic growth.
This is what makes this moment so perilous. While the market wants to believe the evaluation is over, assumptions can be quickly reevaluated amid conflict. We are not experiencing a settled recovery; rather, we are witnessing a fragile pause amid a still-unfolding geopolitical and economic crisis.
I. The Main Market Story: Relief Rally on Top of Unresolved Risk
The dominant theme in the last 16 hours was a dramatic shift from panic pricing to relief pricing.
That shift was driven largely by remarks from President Trump suggesting that the war with Iran may be nearing its end, that US operations are progressing faster than expected, and that Washington may move to keep oil prices in check by escorting tankers, adjusting sanctions, and working with G7 partners ready to release strategic reserves if necessary.
That message hit global markets immediately.
Crude oil reversed sharply:
-
Brent fell below $93
-
WTI fell below $90
This came after prices surged to near $120 in the previous session as major Gulf producers cut output, and tanker traffic through the Strait of Hormuz was heavily restricted.
https://tradingeconomics.com/commodity/brent-crude-oil
https://tradingeconomics.com/commodity/crude-oil
Natural gas also reversed:
-
UK natural gas fell more than 16%
-
European TTF gas fell more than 13%
-
US natural gas also declined
Equity markets responded with broad rebounds:
-
Europe rallied
-
Japan rallied
-
South Korea surged
-
Hong Kong and China advanced
-
Australia recovered
-
India bounced
-
Indonesia rebounded from deep losses
-
Wall Street moved from relief to caution
At the same time, bond yields in some major markets eased as immediate inflation fears cooled.
But none of that means the underlying problem has been solved.
The relief move was based on a narrative: that the conflict may be shorter than feared. It was not based on hard evidence that the energy infrastructure shock is over, that Hormuz is functioning normally, or that LNG supply has been restored. That distinction matters.
II. Energy Markets: The Shock Has Cooled, Not Disappeared
Energy remains the center of gravity for the entire global story.
Oil
Oil’s reversal was dramatic, but it needs to be understood in context.
-
Brent crude fell below $93
-
WTI crude fell below $90
That decline followed:
-
Trump’s comments about a potentially near-term end to the war
-
Signals about waiving oil-related sanctions
-
US Navy tanker escort talk
-
G7 readiness to release strategic reserves
But the reason oil had spiked so violently in the first place has not vanished:
-
The Strait of Hormuz is still closed
-
Tanker traffic remains disrupted
-
Storage facilities across key producers had been filling rapidly
-
Major exporters, including Saudi Arabia, the UAE, Kuwait, and Iraq, had already started curbing production
That means oil fell on expectations, not on a confirmed full normalization of supply.
Natural Gas
The gas story remains more dangerous than the oil story.
-
UK natural gas dropped below 125 pence/therm after hitting a three-year high.gh
-
TTF European gas fell below €50/MWh after recently spiking to a three-year high
-
US natural gas fell to around $3.06/MM. Btu
Yet these pullbacks came while the world’s largest LNG export hub remains offline, as Qatar’s operator remains suspended.
That is critical.
Analysts warned that a prolonged halt in Qatar could wipe out most of the expected global LNG surplus for 2026. Europe is highly exposed because gas storage is below 30% after winter, meaning the continent must refill reserves ahead of the next heating season under already stressed conditions.
Refined fuels
Other energy-linked products also eased:
-
Gasoline futures fell below $2.70/gallon
-
Heating oil slipped toward $3.4/gallon
Again, the market is reacting to hopes of de-escalation. But refined fuel markets remain highly sensitive to tanker access, insurance, sanctions policy, and whether Gulf production returns smoothly.
Saudi Arabia
Saudi industrial production data provided another useful piece of context. Industrial output rose 10.4% year-on-year in January, with oil production rising to 10.1 million barrels per day from 8.9 million a year earlier. That shows how central Saudi output remains to global supply stability. If Gulf flows remain impaired, the world economy will feel it fast.
https://tradingeconomics.com/stream
III. Shipping and Trade Routes: A Quiet Warning Signal
One of the most important pieces of data in the entire batch may not be oil at all.
The Baltic Dry Index fell 7.1% to a one-month low, down to 1,919.
That matters because it tracks rates for transporting dry bulk commodities. When it weakens this sharply in a geopolitical shock, it suggests trade activity and freight demand are already being hit.
Breakdown:
-
Capesize: down 11.8%
-
Panamax: down 2.7%
-
Supramax: down 2.3%
That is not a trivial move. It suggests disruptions to freight activity in the Strait of Hormuz and broader uncertainty in global shipping routes.
If the energy shock deepens, shipping costs, insurance costs, transit times, and commodity flows could all worsen again. That would spread the damage from energy into industrial production, food prices, and trade-dependent economies.
https://tradingeconomics.com/stream
IV. United States: A Market Between Relief and Caution
The US market picture was mixed rather than decisively bullish.
Equities
US stocks wavered after the previous day’s rebound:
-
Futures swung between gains and losses
-
Major indices hovered below the flatline at times
-
Investors kept a preference for cash amid uncertainty
The sectors that stayed under pressure were revealing:
-
Credit-sensitive sectors weakened
-
Private credit firms remained under stress over bad loan fears
-
Asset managers reportedly suffered losses tied to energy volatility
-
Banks were pressured by the prospect of rates staying restrictive
At the same time, some growth and tech names held up better:
-
Amazon moved slightly higher after launching a $37 billion bond offering
-
NVIDIA and AMD stayed steady
-
TSMC’s 30% sales growth in the first two months of the year supported semiconductor sentiment
Bonds
The US 10-year Treasury yield held around 4.11%, down from the prior session’s high near 4.21%.
That tells you the market has reduced some of its immediate inflation panic, but it has not erased it. Traders revived expectations for:
-
a possible July cut
-
a possible September cut
-
about two 25bp cuts this year
Yet the upcoming CPI and PCE reports are not expected to capture the Iran-war effect fully. So the bond market is trading a partial information set.
Labor and housing
US domestic data showed a more nuanced economy than the geopolitical headlines alone would suggest.
-
Existing home sales rose 1.7% to 4.09 million on an annualized basis, beating expectations.
-
Inventory rose 2.4% to 1.29 million
-
Median home price rose 0.3% to $398,000
Housing affordability appears to be improving somewhat, but demand remains muted relative to jobs and wage growth.
Labor data also showed resilience:
-
ADP weekly job growth held at 15,500 per week
-
That was the strongest pace since late November 2025
At the same time:
-
NFIB Small Business Optimism slipped to 98.8
-
Sales expectations weakened
-
Main Street firms remain stressed by competitive pressure
-
59% still reported some supply chain disruption
The US picture, then, is not collapsing. It is an economy still standing, but vulnerable to renewed energy and rate stress.
https://tradingeconomics.com/stream
V. Europe: Relief Bounce on Top of Structural Exposure
Europe rallied on Tuesday, but it may still be the most exposed region if the energy shock returns.
Equity rebound
-
STOXX 50 rose 2.4%
-
STOXX 600 rose 1.8%
-
DAX jumped more than 2%
-
FTSE 100 rose more than 1%
Winners included:
-
ASML
-
HSBC
-
Siemens
-
Banco Santander
-
Volkswagen
-
Hugo Boss
-
Deutsche Lufthansa
-
banks, autos, and airlines broadly
This was a classic relief rally driven by falling oil.
Bonds and currencies
-
German Bund yield eased to 2.84%
-
UK gilt yield fell to 4.49%
-
Sterling strengthened from a three-month low
-
Euro held near two-month lows but stabilized somewhat
Markets moved back toward pricing possible rate cuts in the UK, with around a 50% chance of a cut by September. In the euro area, however, the market still expects at least one ECB hike this year if inflation pressures persist.
Gas vulnerability
Europe’s relief still sits on top of a major risk:
-
Hormuz remains closed
-
Qatar remains suspended
-
Gas storage is below 30%
-
Europe remains heavily dependent on LNG imports after reducing its reliance on Russian pipelines
If LNG supply tightens again, Europe could be hit by:
-
renewed gas price spikes
-
weaker industrial margins
-
tighter monetary conditions
-
weaker output
European country data
The broader European macro picture was mixed and uneven:
Germany
-
Exports fell 2.3%
-
Imports fell 5.9%
-
Trade surplus widened to €21.2 billion
-
Exports to the US rose 11.7%
-
Exports to China fell 13.2%
-
Imports fell to a 17-month low
-
This points to weak domestic demand and still-soft trade momentum
France
-
Current account surplus rose to €2.1 billion, the largest in 13 months
-
Trade deficit narrowed to €1.8 billion, the smallest since 2009
-
Strong improvement in the external balance
Italy
-
Producer prices fell 1.6% year-on-year
-
Domestic energy-related producer deflation remained significant
-
Monthly producer prices rose 1.5%, showing some renewed pressure
Greece
-
Inflation rose to 2.7%
-
EU-harmonized inflation rose to 3.1%
-
Industrial output rose 5.3%
-
The trade deficit narrowed slightly
-
Bond yields fell sharply
Netherlands
-
Inflation confirmed at 2.4%
-
Household consumption was flat
-
Manufacturing output rose modestly
Sweden
-
Monthly GDP contracted 1.1%
-
Industrial output rose only 1.9% year-on-year but fell sharply month-on-month
-
New orders fell 3.9% year-on-year, first decline in eight months
-
Household spending rebounded 0.7%
Finland
-
Industrial output was flat year-on-year and down month-on-month
Austria
-
Industrial output rose 0.3%
Slovakia
-
Industrial output rebounded 2.7%
Slovenia
-
Industrial output still fell 3.0%
Bulgaria
-
Industrial output down 8.6%, thirteenth straight decline
-
Construction is still growing year-on-year, but is slowing
Czech Republic
-
Inflation confirmed at 1.4%, lowest since 2016
Hungary
-
Inflation fell to 1.4%, the lowest since 2016
Denmark
-
Inflation eased to 0.7%
Norway
-
Inflation fell to 2.7%
Lithuania
-
Inflation eased to 2.3%
-
The trade deficit widened
-
Producer prices still falling, though less sharply
Europe, in other words, is not one story. It is a continent where the market bounced, but the economy underneath still looks fragile and highly exposed to renewed energy stress.
https://tradingeconomics.com/stream
VI. Asia: Strong Rebounds, But Deep Vulnerabilities Remain
Asia rallied hard on the retreat in oil prices, but the region remains highly sensitive to energy prices, trade flows, and currency stress.
Japan
Japan had one of the more complicated and important data sets.
Markets:
-
Nikkei up 2.88%
-
Topix up 2.47%
-
Yen strengthened to around 157.6
-
10-year yield fell to around 2.17%
Growth data:
-
Q4 GDP revised to 0.3% qoq
-
Annualized GDP revised to 1.3%
-
better domestic demand
-
stronger government spending
-
better business investment
Wages:
-
nominal wages up 3.0%
-
Real wages rose 1.4%, the first increase in 13 months
Consumption:
-
household spending still fell 1.0% y/y
-
monthly spending fell 2.5%
Machinery:
-
machine tool orders up 24.2% y/y
Japan looks stronger than feared in GDP and wages, but household demand remains uneven, and the economy remains vulnerable to imported energy shocks.
South Korea
-
KOSPI surged 5.35%
-
Won remained volatile around 1,470
-
Q4 GDP revised to -0.2% qoq
-
annual growth still 3.0%
-
domestic demand weak
-
exports down 1.7%
-
imports down 1.5%
South Korea is one of the clearest examples of a market-relief rally masking underlying economic softness
China
China’s trade data was one of the strongest in the entire report:
-
Exports up 21.8%
-
Imports up 19.8%
-
Trade surplus $213.62 billion
-
crude imports up 15.8%
-
copper ore imports up 4.9%
-
Coal imports up 1.5%
-
gas imports down 1.1%
Markets:
-
Shanghai Composite rose
-
Chinese yields rose modestly
-
The offshore yuan stabilized somewhat
China appears better positioned than many peers to weather an oil shock, thanks to stockpiles and diversification. However, weaker imports from the US and continued trade rerouting indicate that structural shifts are still underway.
Hong Kong
-
Hang Seng rose stronglyThe
-
Hong Kong dollar touched a 29-week low earlier
-
The market rallied on geopolitics and China trade data
India
-
Sensex rebounded
-
Rupee recovered after hitting record lows
-
10-year yield eased to 6.68%
-
RBI remains active in currency markets
-
India remains deeply exposed to oil because of its import dependence
Indonesia
-
IDX Composite surged 1.8%
-
Rupiah remained weak
-
Retail sales up 5.7%
-
domestic confidence softened
-
Inflation and FX reserves remain concerns
Australia
-
ASX 200 up 1.1%
-
Australian dollar rose
-
Consumer sentiment improved
-
Business confidence turned negativeThe
-
building permits fell sharply
-
House approvals were still modestly positive
New Zealand
-
NZX 50 ended nearly flatThe
-
NZ dollar weakened
-
Rate hike expectations remain elevated if inflation does not cool
Asia’s rebound was real, but it remains conditional on the assumption that oil will stay down and the war will not broaden again.
https://tradingeconomics.com/stream
VII. Emerging Markets, Africa, and the Global South
The report also showed a highly uneven picture across emerging and frontier economies.
South Africa
-
GDP up 0.4% qoq
-
annual growth 0.8%
-
full-year growth 1.1%
-
10-year yield eased
-
Rand recovered somewhat
South Africa benefited from easing risk aversion, but its central bank is still closely monitoring inflation risk scenarios.
Brazil
-
Ibovespa extended recovery
-
Petrobras fell with oil
-
fiscal adjustment and high rates remain in focus
Canada
-
TSX tried to recover
-
Gold miners gained
-
oil producers are weaker as crude fell
-
markets are still watching inflation and rates
Saudi Arabia
-
Industrial production rose strongly
-
Oil output is materially higher than a year ago
Israel
-
Q4 annualized GDP growth revised up to 4.2%
-
But private consumption and fixed investment both weakened
-
Exports were strong, imports were weak
Egypt
-
Inflation jumped to 13.4%
-
fastest since July 2025
-
housing and food pressures remain intense
Rwanda
-
Inflation rose to 7.9%
Mozambique
-
Inflation rose to 3.2%, with cyclone effects contributing
Moldova
-
Inflation rose to 5.1%
Belarus
-
Inflation cooled to 5.6%
Mongolia
-
The trade surplus widened sharply
Kazakhstan
-
Producer inflation rose to 6.4%
The picture across the Global South is one of continued sensitivity to food, fuel, and exchange-rate shocks, even as developed markets celebrate falling oil prices.
https://tradingeconomics.com/stream
VIII. Commodities Beyond Oil: The Ripple Effects Are Everywhere
The commodity complex showed clearly how geopolitical stress spreads through the wider economy.
Energy losers on the day
-
Natural Gas UK: -16.35%
-
Natural Gas EU: -14.01%
-
WTI: -9.43%
-
Brent: -9.34%
Metals
-
Silver: +2.47%
-
Lithium carbonate: +2.42%
-
Platinum: +2.27%
-
Gold: +0.75%
-
Aluminum continued to retreat from its highs, but inventory risks remain
Agriculture
-
Wheat: +5.11%
-
Cotton: +0.96%
-
Rice: +0.77%
-
Corn: -0.71%
Detailed moves:
-
Wheat stabilized after a geopolitical spike, but drought and winter wheat conditions remain a real supply concern
-
Corn retreated as oil eased, but export demand remains strong
-
Soybeans pulled back as oil fell and traders looked ahead to WASDE
-
Palm oil retreated on weaker crude and edible oils, though stocks remain tight
-
Grain markets remain tied to oil through fertilizer, freight, and biofuel channels
This is important. Even when oil prices fall, the earlier shock can still have secondary effects on food, metals, and shipping costs.
https://tradingeconomics.com/stream
IX. Currencies and Crypto: Risk-On Rebound, Not Full Confidence
Currencies shifted as safe-haven demand for the dollar eased.
-
The dollar index fell below 99
-
Sterling recovered
-
Euro stabilized
-
Yen strengthened
-
Australian dollar gained
-
Rupee rebounded
-
Won remained weak
-
Rupiah remained fragile
-
Hong Kong dollar tested lows
Crypto rebounded as well:
-
Bitcoin up roughly 2%–4%, around $70,000
-
Ether higher
-
Ripple higher
This tells us investors were willing to re-enter risk, but not that they believe the geopolitical danger has vanished.
https://tradingeconomics.com/stream
X. Different Perspectives on What This Means
1. The market perspective
The market is pricing a shorter war. That is the simplest explanation for the rebound. Falling oil gave relief to stocks, bonds, currencies, and rate expectations.
2. The central bank perspective
Central banks are not out of danger. A single day of lower oil does not erase the inflation risk if Hormuz remains closed and LNG remains constrained. The next CPI and PCE prints may not yet show the war effect.
3. The industry perspective
Energy-intensive sectors, airlines, shipping firms, industrial importers, and credit-sensitive firms remain exposed. Even relief rallies do not change their structural vulnerability if the conflict reignites.
4. The household perspective
Households will feel this through fuel, utilities, food, and financing costs. A temporary market rally is not the same thing as lasting relief in the real economy.
5. The Watchdog perspective
This is the key point: the market may be trying to move on before the underlying system actually can. Oil has pulled back, but the architecture of risk is still in place. Hormuz is still impaired. LNG is still disrupted. Shipping is still signaling weakness. The economy is still reacting to headlines rather than a durable resolution.
https://tradingeconomics.com/stream
XI. Possible Outcomes and What Could Arise Next
Scenario One: Fast de-escalation
If the war really is nearing its end:
-
Oil could continue lower
-
Gas prices could stabilize
-
Stocks could extend gains
-
central banks could return to softer policy paths
-
credit pressure could ease
Scenario Two: False dawn
If the current rally is just a pause:
-
Oil could surge again
-
natural gas could spike anew
-
Europe could face a renewed energy scare
-
Risk assets could reverse hard
-
Bond markets could reprice inflation quickly
Scenario Three: Shipping-led slowdown
If Hormuz and freight remain constrained:
-
Shipping volumes could weaken further
-
Bulk commodity demand could fall
-
Manufacturing supply chains could slow
-
trade-sensitive economies could weaken
Scenario Four: Stagflation-lite
If energy remains elevated but not catastrophic:
-
Inflation could stay sticky
-
growth could cool
-
Rate cuts could be delayed
-
households and small businesses could take the hit
Scenario Five: Global divergence
Some countries may weather this far better than others:
-
China may absorb more of the shock because of stockpiles
-
Europe may remain especially exposed
-
India and South Korea remain vulnerable to imported energy
-
Commodity exporters may outperform importers
https://tradingeconomics.com/stream
Conclusion
Overall, the last 16 hours have not shown a return to normal in the world economy. Instead, they showed a world economy trying to recover from shock while still within the blast radius.
Yes, crude has fallen sharply. Meanwhile, equity markets in Europe and Asia have rallied. At the same time, bond yields have eased in several places. Even so, the dollar has lost some of its safe-haven premium.
However, none of that changes the deeper truth.
In reality, this is still a global economy operating in the fog of war.
On the one hand, the market is hoping for a short conflict. However, the data shows the system remains exposed if that hope proves wrong. For example, the Strait of Hormuz remains central. Meanwhile, LNG remains a live risk. In addition, shipping companies are already warning of strain. At the same time, trade flows are shifting. Consequently, inflation expectations can still reverse. Moreover, many economies remain highly vulnerable to another energy-driven shock.
Ultimately, that is the Watchdog takeaway.
In other words, this is not just a story about oil falling. Rather, it is a story about how quickly the modern global economy can move from panic to relief without ever truly resolving the underlying danger.
Watchdog News — Facts Over Factions